LOCALYSED - A Geospatial Locality Recommendation System
A full-stack geospatial and graph-based web application that recommends optimal residential localities in Mumbai.
Full StackGISData EngineeringGeospatialGraph DatabaseReactPostGISNeo4jSpatial Analytics
project
Introduction and Motivation
LOCALYSED is a locality recommendation web application developed as an academic project leveraging spatial and graph databases. The system addresses a critical, real-world problem:
Finding a suitable locality to live in is a multi-dimensional, time-consuming, and cognitively demanding task.
It replaces manual locality comparison with an automated, data-driven, and interactive recommendation system that evaluates city regions based on geographical characteristics, amenity availability, connectivity, and personalized user preferences.
Problem Statement and Existing Gaps
Selecting a locality involves balancing multiple conflicting criteria (e.g., distance to work vs. proximity to schools). Existing solutions often focus on price and region, produce generic lists, and crucially, do not model spatial relationships and connectivity in a nuanced way, leading to unintentional compromise on personal preferences.
System Architecture: A Hybrid Approach
LOCALYSED follows a three-tier architecture with a critical hybrid Data Layer to manage different data types effectively.
The application layer bridges the front-end (React/Mapbox GL JS) with the databases, using JSON / GeoJSON for data exchange.
Data Engineering and Geospatial Processing
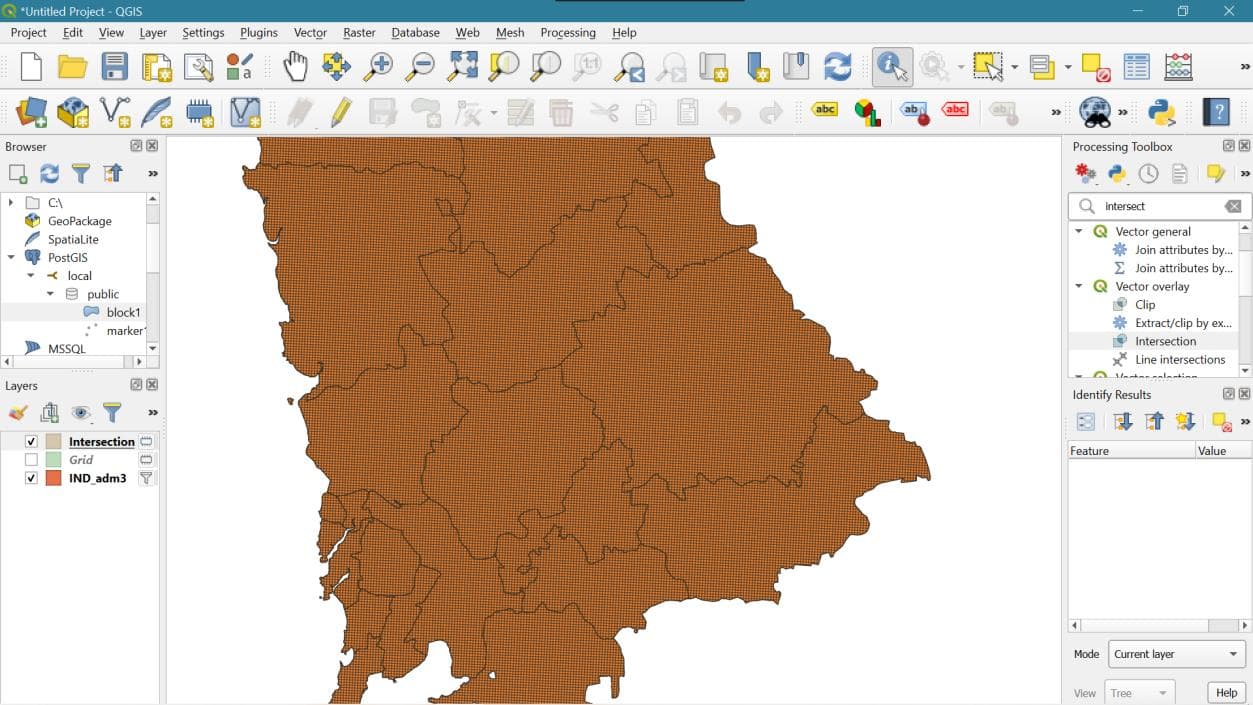
City Block Generation
The core of the analysis relies on dividing the Mumbai region into uniform 500m × 500m grid blocks using QGIS. Each block serves as a candidate locality. This process involves spatial filtering, grid creation, and intersection with administrative boundaries.
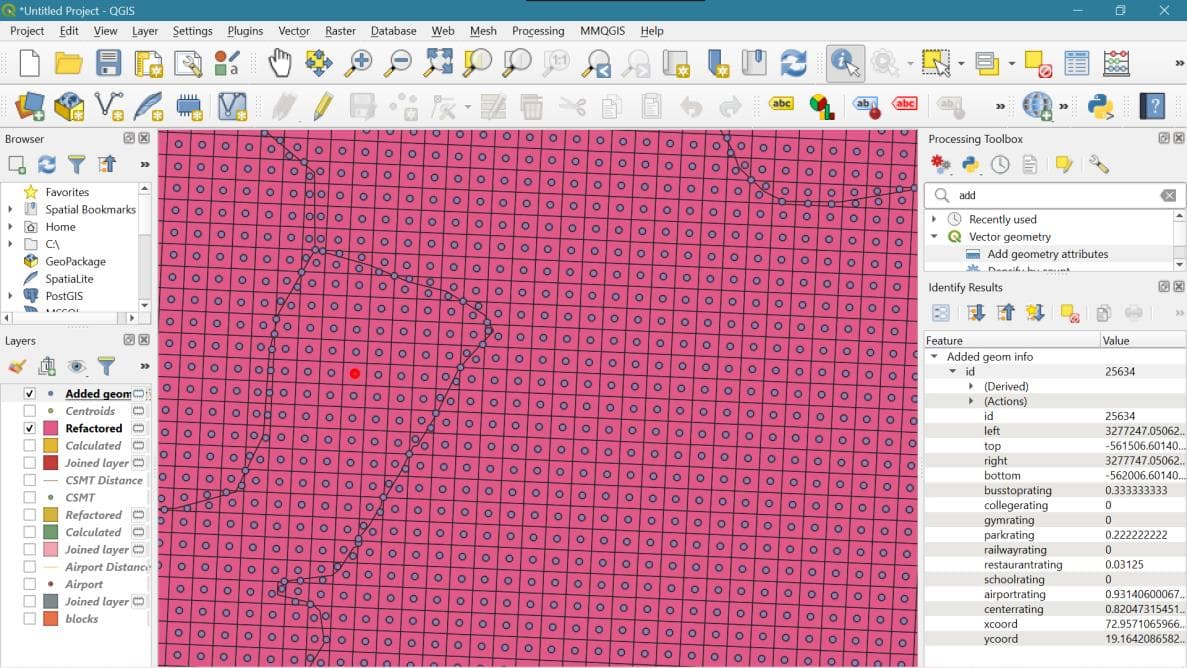
Amenity Rating Computation
Spatial data (amenity points) was spatially joined with the polygon blocks. This allowed for the calculation of an amenity count per block. These counts were then normalized between 0 and 1 (max-min normalization) to ensure fair comparison across different types of amenities. Distance-based metrics (e.g., Airport Proximity, City Center Proximity) were calculated from the block centroid and similarly normalized.
Graph Database for Connectivity (Neo4j)
Neo4j was employed to model complex connectedness and proximity relationships that are computationally expensive for relational databases. This enables efficient pathfinding and proximity queries.
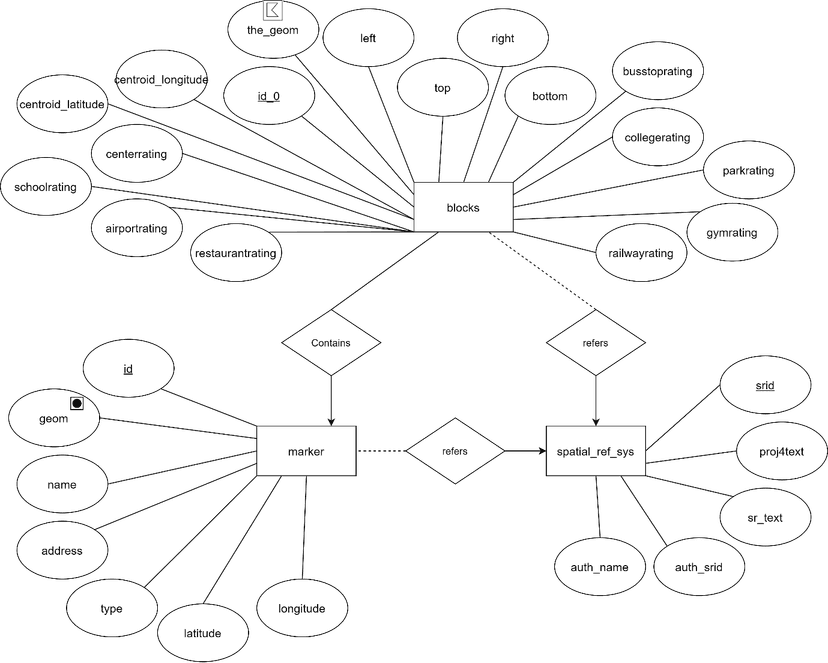
Design Model
Nodes:
blockmarkerspatial_ref_system
Relationships:
(:block)-[:HAS {distance}]->(:marker)(:block)-[:NEIGHBOUR]->(:block)(:block)--[:refers]->(:spatial_ref_sys)(:marker)--[:refers]->(:spatial_ref_sys)
Recommendation Algorithm
The final ranking is determined by a simple but effective Weighted Sum Model (WSM). Each normalized block rating is multiplied by a user-defined importance weight to calculate a Composite Score.
The composite score for a locality block j is calculated as:
Formula:
- : User-defined importance weight for criterion
i - : Normalized rating (0 to 1) of block
jfor criterioni
The backend ranks the blocks by and sends the results as GeoJSON to the client for rendering via Mapbox GL JS, using a color gradient (red → green) to visualize the score.
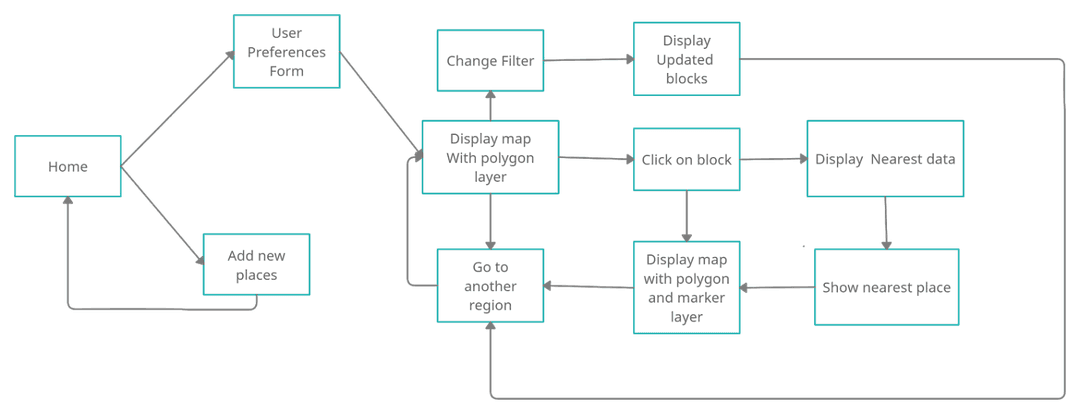
Block Diagram
Key Features and Learnings
- Interactive Map: Color-coded results and dynamic updates based on user filter adjustments.
- Adjustable Filters: Real-time re-ranking using slider-based importance controls.
- Nearby Amenity Visualization: Click on a block to view surrounding amenities and distances.
- Hybrid Database Mastery: Designing and integrating PostgreSQL/PostGIS with Neo4j.
- GIS Workflow: Practical data processing experience using QGIS.
- Scalable Design: Architecture allows extension to other cities by simply importing new spatial datasets.
Conclusion
LOCALYSED successfully demonstrates the integration of geospatial analysis, graph modeling, and full-stack development to solve a real-world urban problem, showcasing strong system design skills and data engineering practices.
Your Take?
How did this piece land for you? React or drop your thoughts below.
Join the Conversation
X
More Stories from My Engineering Journey
Explore other projects and systems I've engineered.

